OPINION: Container shipping: Solid demand growth reduces spot rate volatility
As freight rates are coming back from the abyss, their actual rise seems to be magnified beyond their actual performance. Some container spot freight rates are up more than 100 per cent from the very low levels of last year, but may still be at a loss-making level now and so spot rates are not the best indicator for market profitability.
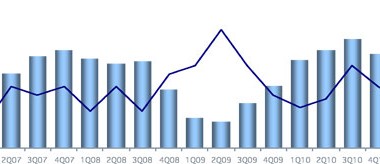
The broad-scoped China Containerised Freight Index (CCFI) offers a solid and alternative indication. The CCFI composite hit an all-time low at 632.36 on 29 April 2016. By 11 August 2017, it was back at 856.5 and now comparing year-to-date growth, the CCFI is up by 20.7 per cent versus the same period last year.
By contrast, the spot rates from Shanghai into Northern Europe are up 64 per cent year-to-date, year-on-year. The spot rates for containers bound for the US have gone up by 45 to 50 per cent over the same period.
It’s not only freight rates which have risen this year. Charter rates left the doldrums and went up sharply in the first four months of 2017, only to slide back down, but during June/July most of the slide had been regained.
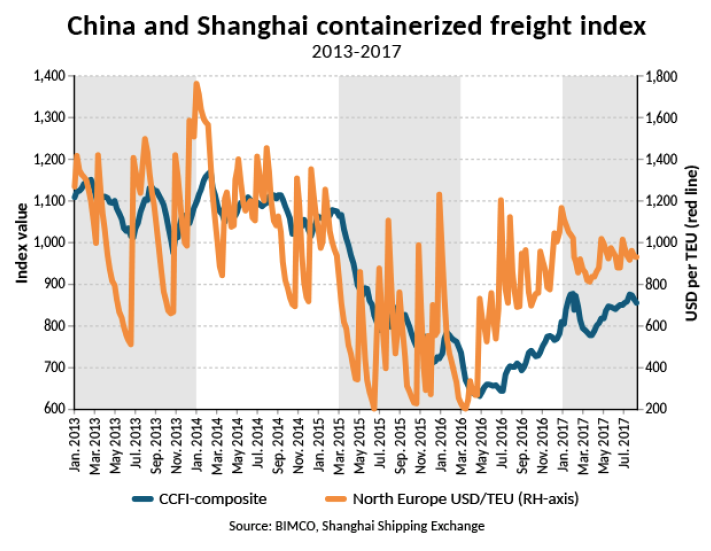
The extreme volatility of previous years has been reduced for spot rates on the Shanghai-Northern Europe trade lane. A sign of improving demand and better market conditions since Q4 2016.
The improved freight rates come on the back of strong demand growth during the first half of 2017. Combined with steady fleet growth of 1.8 per cent the fundamental balance has improved noticeably. Global container shipping demand grew by five per cent in H1 2017, over the same period last year (source: CTS).
On both the key long front haul trades out of the Far East into Europe and North America, demand grew rapidly by 5.2 per cent and 10.0 per cent respectively (source: CTS). BIMCO’s own data on inbound loaded containers to the US West Coast went up by 5.4 per cent and to the East Coast by 10.6 per cent. The fastest growing import ports on the East Coast were Houston (+26 per cent) and Savannah (+13 per cent). While the main port – Port of New York and New Jersey (PANYNJ) – grew by only 5.5 per cent, due to very weak imports in February and March.
Growth on the head haul trades is vital, as it pushes utilisation higher where it’s most needed, avoiding blank sailings and filling the ships to a larger extent than in recent years. Head haul trades deliver the higher freight rates, whereas back hauls merely reduce the costs of repositioning the ship.
Moving forward, PANYNJ, should benefit from the early completion of the Bayonne Bridge navigational clearance project. With the new air draft of65.5 metres, ships up to 18,000 TEU will now be able to reach the terminal “behind” the bridge (9,800 TEU was the maximum before the elevation). This will prompt carriers to optimise their networks once again, as most US East Coast ports have upgraded their terminals in recent years to accommodate the ultra large container ships.
2017 is following the trend seen in 2011-2012 and 2014-2015, of US importers increasingly directing cargo towards the US East Coast ports.
As of August 7, 182 ships (474,000 TEU) were idled (source: Alphaliner). As the idle fleet hasn’t changed much over the previous three months, demand growth has lifted rates instead of reactivating the unemployed ships. This is one of the reasons for the improved conditions – the careful handling of supply.
Supply
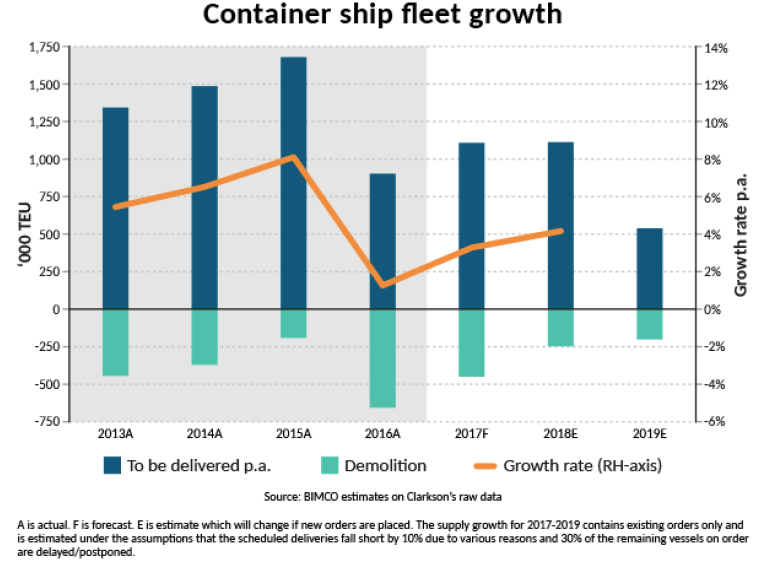
The significant slowdown in demolition comes as no surprise. The magnitude, however is still striking. Remember that a lot of container shipping companies are still losing money daily. But the simple fact that rates have climbed and managed to stay up, means owners shy away from scrapping their ships.
June saw only seven small units sold for demolition (9,639 TEU in total), in comparison to the all-time high level in January where 99,899 TEU (29 units) left the fleet. This is a drop of 90 per cent.
BIMCO forecast a full year demolition of 450,000 TEU, out of which 306,824 TEU had already been demolished by mid-August. This is in line with our forecast that sees the second half of the year with continued fleet growth, low demolition activity and a slower demand growth than was seen in the first half.
The final four and a half months will see more ultra large container capacity being launched. The scheduled order book shows 31 units with a capacity higher than 10,000 TEU, out of which 11 are larger than 20,000TEU. BIMCO estimates that up to 25 of these ships will be delivered.
Fortunately, we still see almost no new orders being placed. Less than 400,000 TEU have been contracted since December 2015. This is extraordinary. In comparison, July 2015 alone, saw orders for 435,268 TEU placed (50 contracts). In the same period, the orderbook has come down from four million TEU to 2.6 million TEU. The lowest TEU level since 2003.
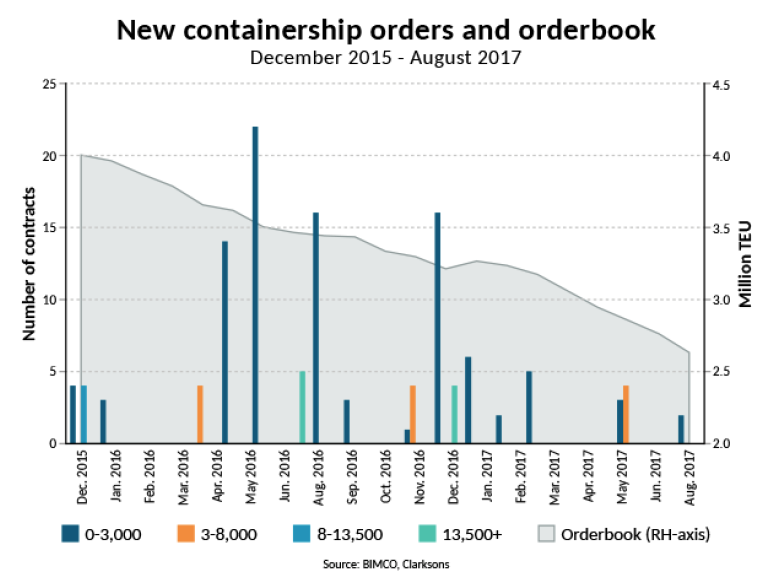
BIMCO expects that this low level will be difficult to maintain, as optimism in the market combined with hungry shipyards and shipping companies being eager to be top dog is a toxic cocktail.
One year ago, the container shipping fleet surpassed the 20 million TEU mark, only to increase demolition and bring it back below this figure. Now we are back above the 20 million TEU mark again, this time for good. The fleet now holds capacity of 20,356,656 TEU. Year-to-date, the fleet has grown by 1.8 per cent and BIMCO forecasts that the rate will hit 3.3 per cent for the full year.
665,850 TEU of the new capacity is now active and some 450,000 TEU will be delivered during the remainder of the year. 41 ships with an average size of 14,223 TEU constitute 88 per cent of additional tonnage, ranging from 9,400 TEU to 21,413 TEU. The latter is the OOCL Hong Kong, which will be joined by four sisters from Samsung HI later this year.
Deliveries scheduled for 2018 are equally biased toward the larger sizes, as the upscaling of network capacity and hunt for lower unit costs continues. Currently 77 ships with a capacity of 9,400 TEU and an average size of 15,578 TEU will amount to 82 per cent of the new influx. However, it is anticipated that postponements and delays are likely to impact this schedule.
Outlook
Since BIMCO’s last report in mid-April, the consolidation amongst carriers has continued. First, the three Japanese conglomerates merged their container lines into ONE (Ocean Network Express), then there was COSCO’s takeover of OOCL and in August we saw the formation of the Korea Shipping Partnership (KSP).
Whereas ONE is a merger of business units, at least according to the US Federal Maritime Commission, that had to give a final decision – rejection or approval – to the US Department of Justice; KSP is not. At least not yet. It remains to be seen whether KSP can reap the benefits from the partnership which is needed to counter the pressure from harsh competition on its main intra-Asian trade lanes.
BIMCO sees 2015/2016 as the real low point of the present crisis and 2017 is a step in the right direction for the industry. Demand growth will most likely outstrip supply growth for the second year in a row. The last time we saw that, was in 2010-2011.